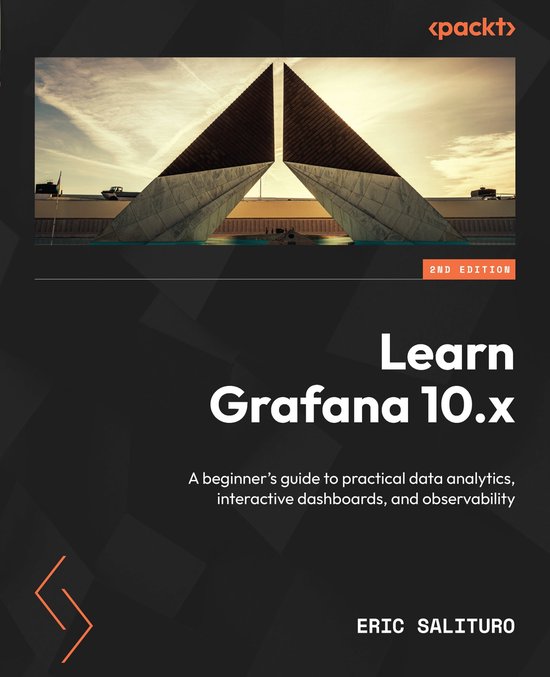
Learn Grafana 10.x
Get up and running with building data pipelines and creating interactive dashboards to visualize, monitor, and present a wide variety of time-series data with this comprehensive introductory guide
Key Features- Install, set up, and configure Grafana for real-time data analysis, visualization, and alerting
- Visualize and monitor data using data sources such as InfluxDB, Telegraf, Prometheus, and Elasticsearch
- Explore Grafana's cloud support with Microsoft Azure, Amazon CloudWatch, and Google Cloud Monitoring
- Purchase of the print or Kindle book includes a free PDF eBook
- Learn the techniques of data visualization using Grafana
- Get familiar with the major components of Time series visualization
- Explore data transformation operations, query inspector, and time interval settings
- Work with advanced dashboard features, such as annotations, variable-based templating, and dashboard linking and sharing
- Connect user authentication through Okta, Google, GitHub, and other external providers
- Discover Grafana’s monitoring support for cloud service infrastructures
This book is for business intelligence developers, business analysts, data analysts, and anyone interested in performing time-series data analysis and monitoring using Grafana. You’ll also find this book useful if you’re looking to create and share interactive dashboards or get up to speed with the latest features of Grafana. Although no prior knowledge of Grafana is required, basic knowledge of data visualization and some Python programming experience will help you understand the concepts covered in the book.
| Auteur | | Eric Salituro |
| Taal | | Engels |
| Type | | E-book |
| Categorie | |


