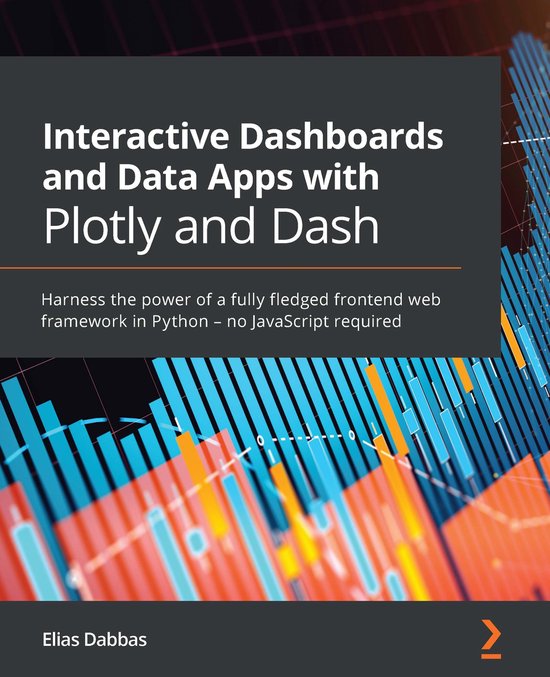
Interactive Dashboards and Data Apps with Plotly and Dash
Build web-based, mobile-friendly analytic apps and interactive dashboards with Python
Key Features- Develop data apps and dashboards without any knowledge of JavaScript
- Map different types of data such as integers, floats, and dates to bar charts, scatter plots, and more
- Create controls and visual elements with multiple inputs and outputs and add functionality to the app as per your requirements
- Find out how to run a fully interactive and easy-to-use app
- Convert your charts to various formats including images and HTML files
- Use Plotly Express and the grammar of graphics for easily mapping data to various visual attributes
- Create different chart types, such as bar charts, scatter plots, histograms, maps, and more
- Expand your app by creating dynamic pages that generate content based on URLs
- Implement new callbacks to manage charts based on URLs and vice versa
This Plotly Dash book is for data professionals and data analysts who want to gain a better understanding of their data with the help of different visualizations and dashboards – and without having to use JS. Basic knowledge of the Python programming language and HTML will help you to grasp the concepts covered in this book more effectively, but it’s not a prerequisite.
| Auteur | | Elias Dabbas |
| Taal | | Engels |
| Type | | E-book |
| Categorie | | Computers & Informatica |
